Please Sign in to view recently saved searches.
Summary Analysis of Indian Import Customs Data in 2023
India's import volume in 2023 amounted to US$670.25 billion, marking a decrease of 6.9% compared to the previous year.
The top 3 import trading partners for India in 2023 were China, ASEAN, and the EU, accounting for 14.9%, 11.8%, and 9.3% of India's total imports, respectively. Notably, imports from China, despite being the highest, experienced a decrease of 3.0%, while imports from Russia saw significant growth, increasing by 78.2% year-on-year. Among the top ten partners, the EU, Russia, South Korea, and Switzerland maintained positive year-on-year growth rates.
In terms of import categories, mineral products, mechanical and electrical products, and jewelry were the top 3 imported categories. Mineral products remained the largest category by scale, amounting to US$229.20 billion, although it experienced a 15.4% decrease compared to the previous year. Notably, plant products showed the highest growth rate at 12.8%. Mechanical and electrical products, base metals, instrumentation, and plant products sustained positive year-on-year growth rates among the main categories.
When analyzing India's main import partners within specific categories, Russia, Iraq, and Saudi Arabia were the top 3 purchasing countries for mineral products, while China, the EU, and ASEAN were the primary purchasers of mechanical and electrical products. The United Arab Emirates and Switzerland dominated the jewelry category as major purchasing countries.
Summary Analysis of Indian Export Customs Data in 2023
India's export value in 2023 totaled US$431.26 billion, experiencing a 4.7% decrease compared to the previous year.
The top 3 global export trading partners for India in 2023 were the United States, the European Union, and ASEAN. Despite being the largest export destination, exports to the United States decreased by 5.4%, while exports to the United Kingdom saw a notable growth rate of 10.9%. Among the top ten partners, five maintained positive year-on-year growth rates.
Mineral products, electromechanical products, and chemical products were the top 3 export categories for India in 2023. Mineral products remained the largest category by value, although it saw a 6.6% decrease compared to the previous year. Mechanical and electrical products exhibited the highest growth rate at 14.4%. Among the main categories, organic and electronic products and transportation equipment also sustained positive year-on-year growth rates.
In terms of destination countries for specific export categories, the EU, ASEAN, and the United Arab Emirates were the top 3 destinations for mineral products, while the United States and the European Union were the primary destinations for mechanical and electrical products. The United States and the European Union were also the major destinations for chemical products.
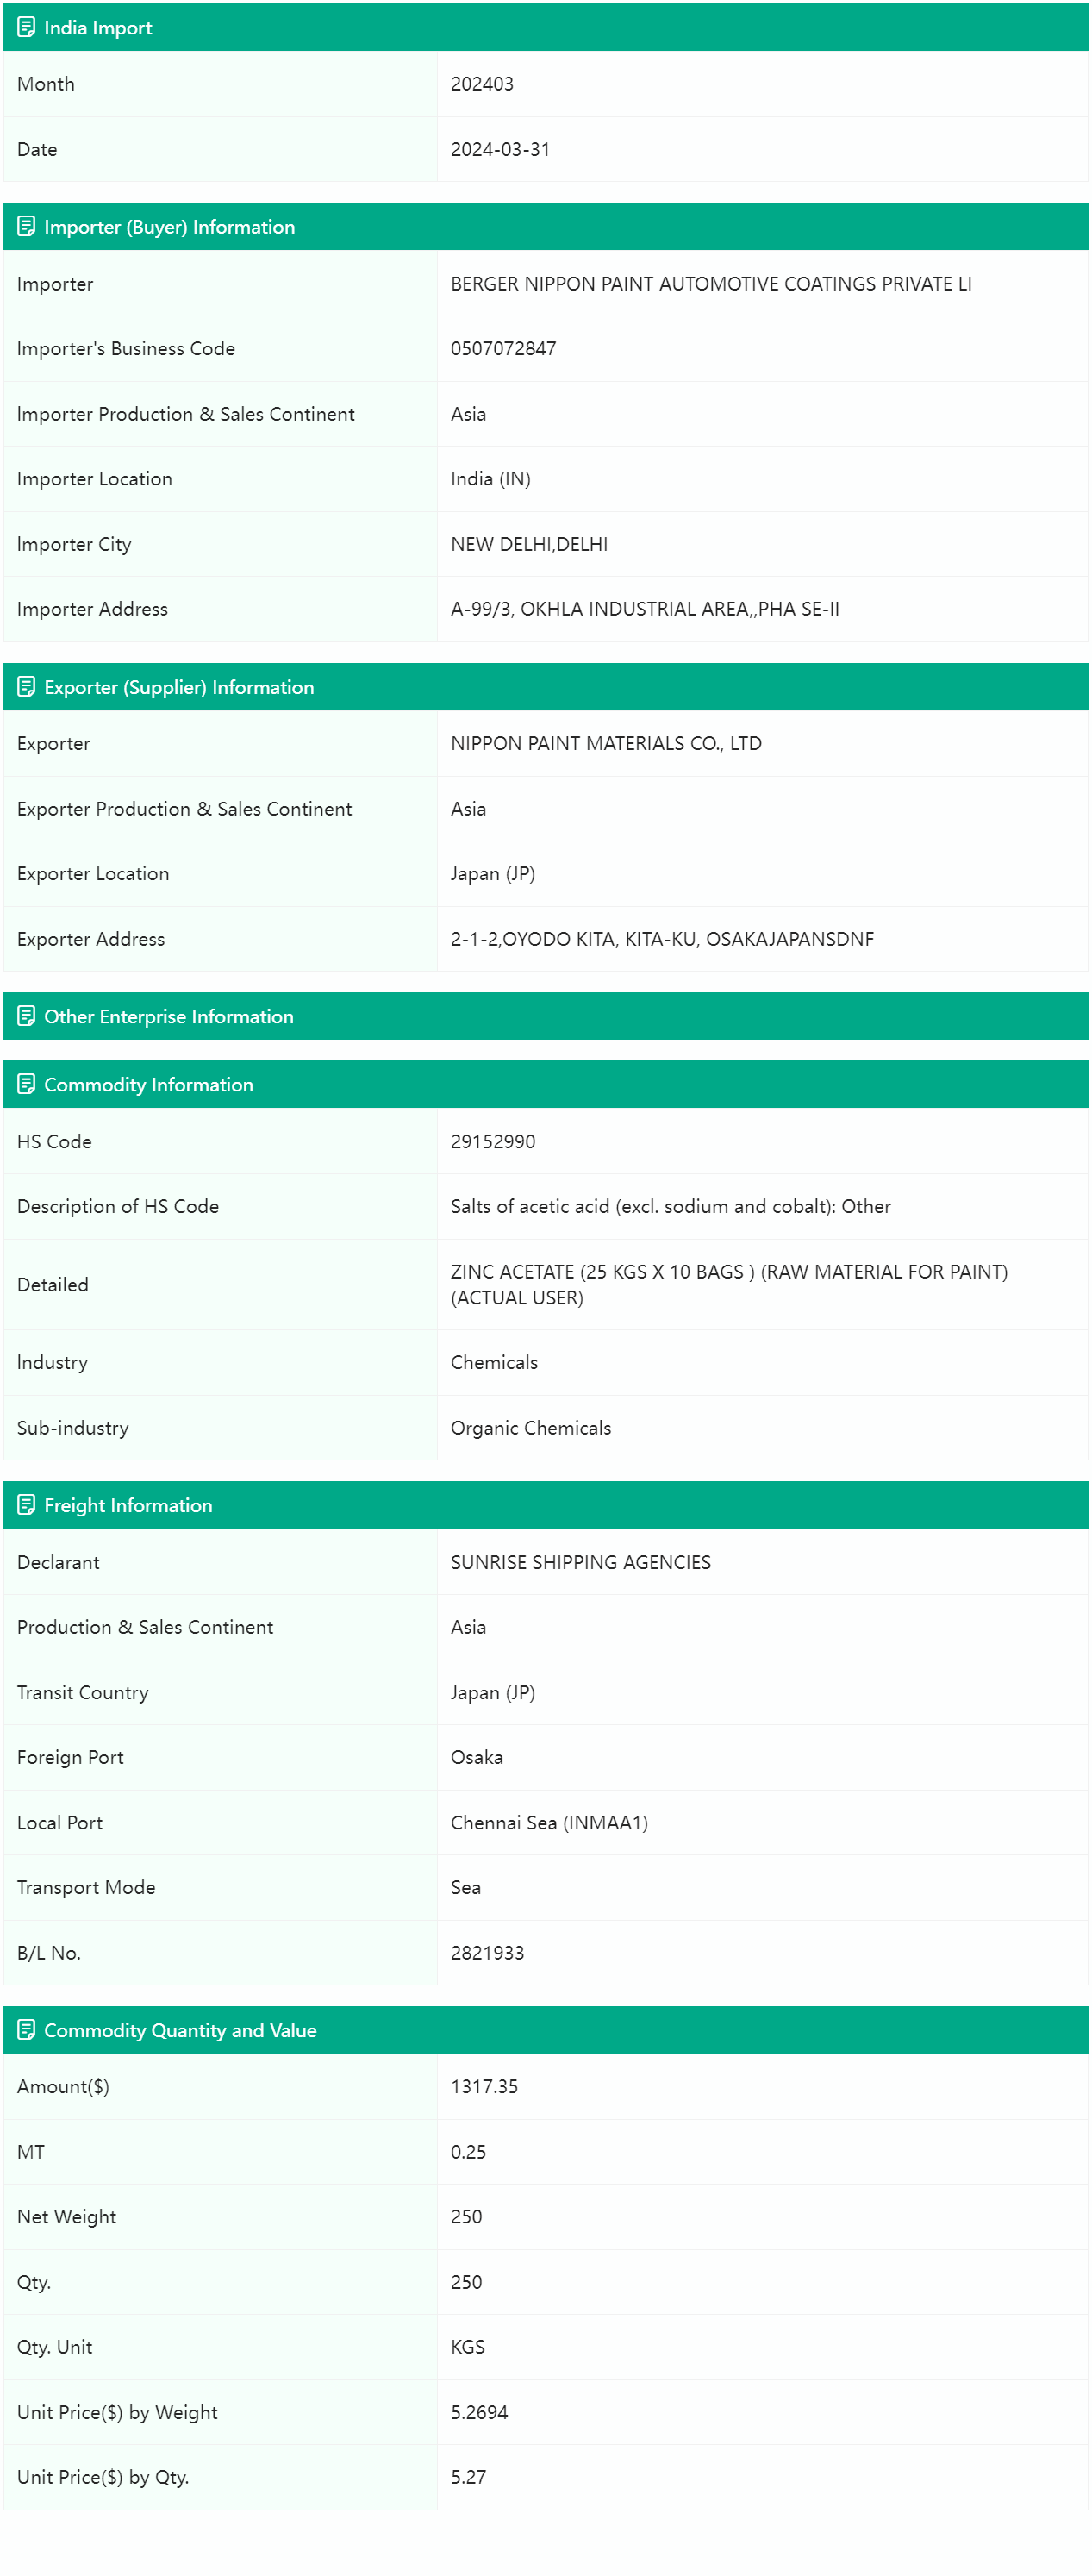
Blooming Trade Data provides up-to-date Indian customs data, allowing users to access and analyze detailed transaction information of buyers and suppliers in India. The data includes corporate information, product details, freight information, volume, price, and other key transaction details.
Do you want to understand market demand in India? Are you looking to expand your business into the Indian market? Are you seeking to foster closer relationships with clients and secure reliable suppliers within India?

Sample Data


